tterminal.com / v2 / dashboard
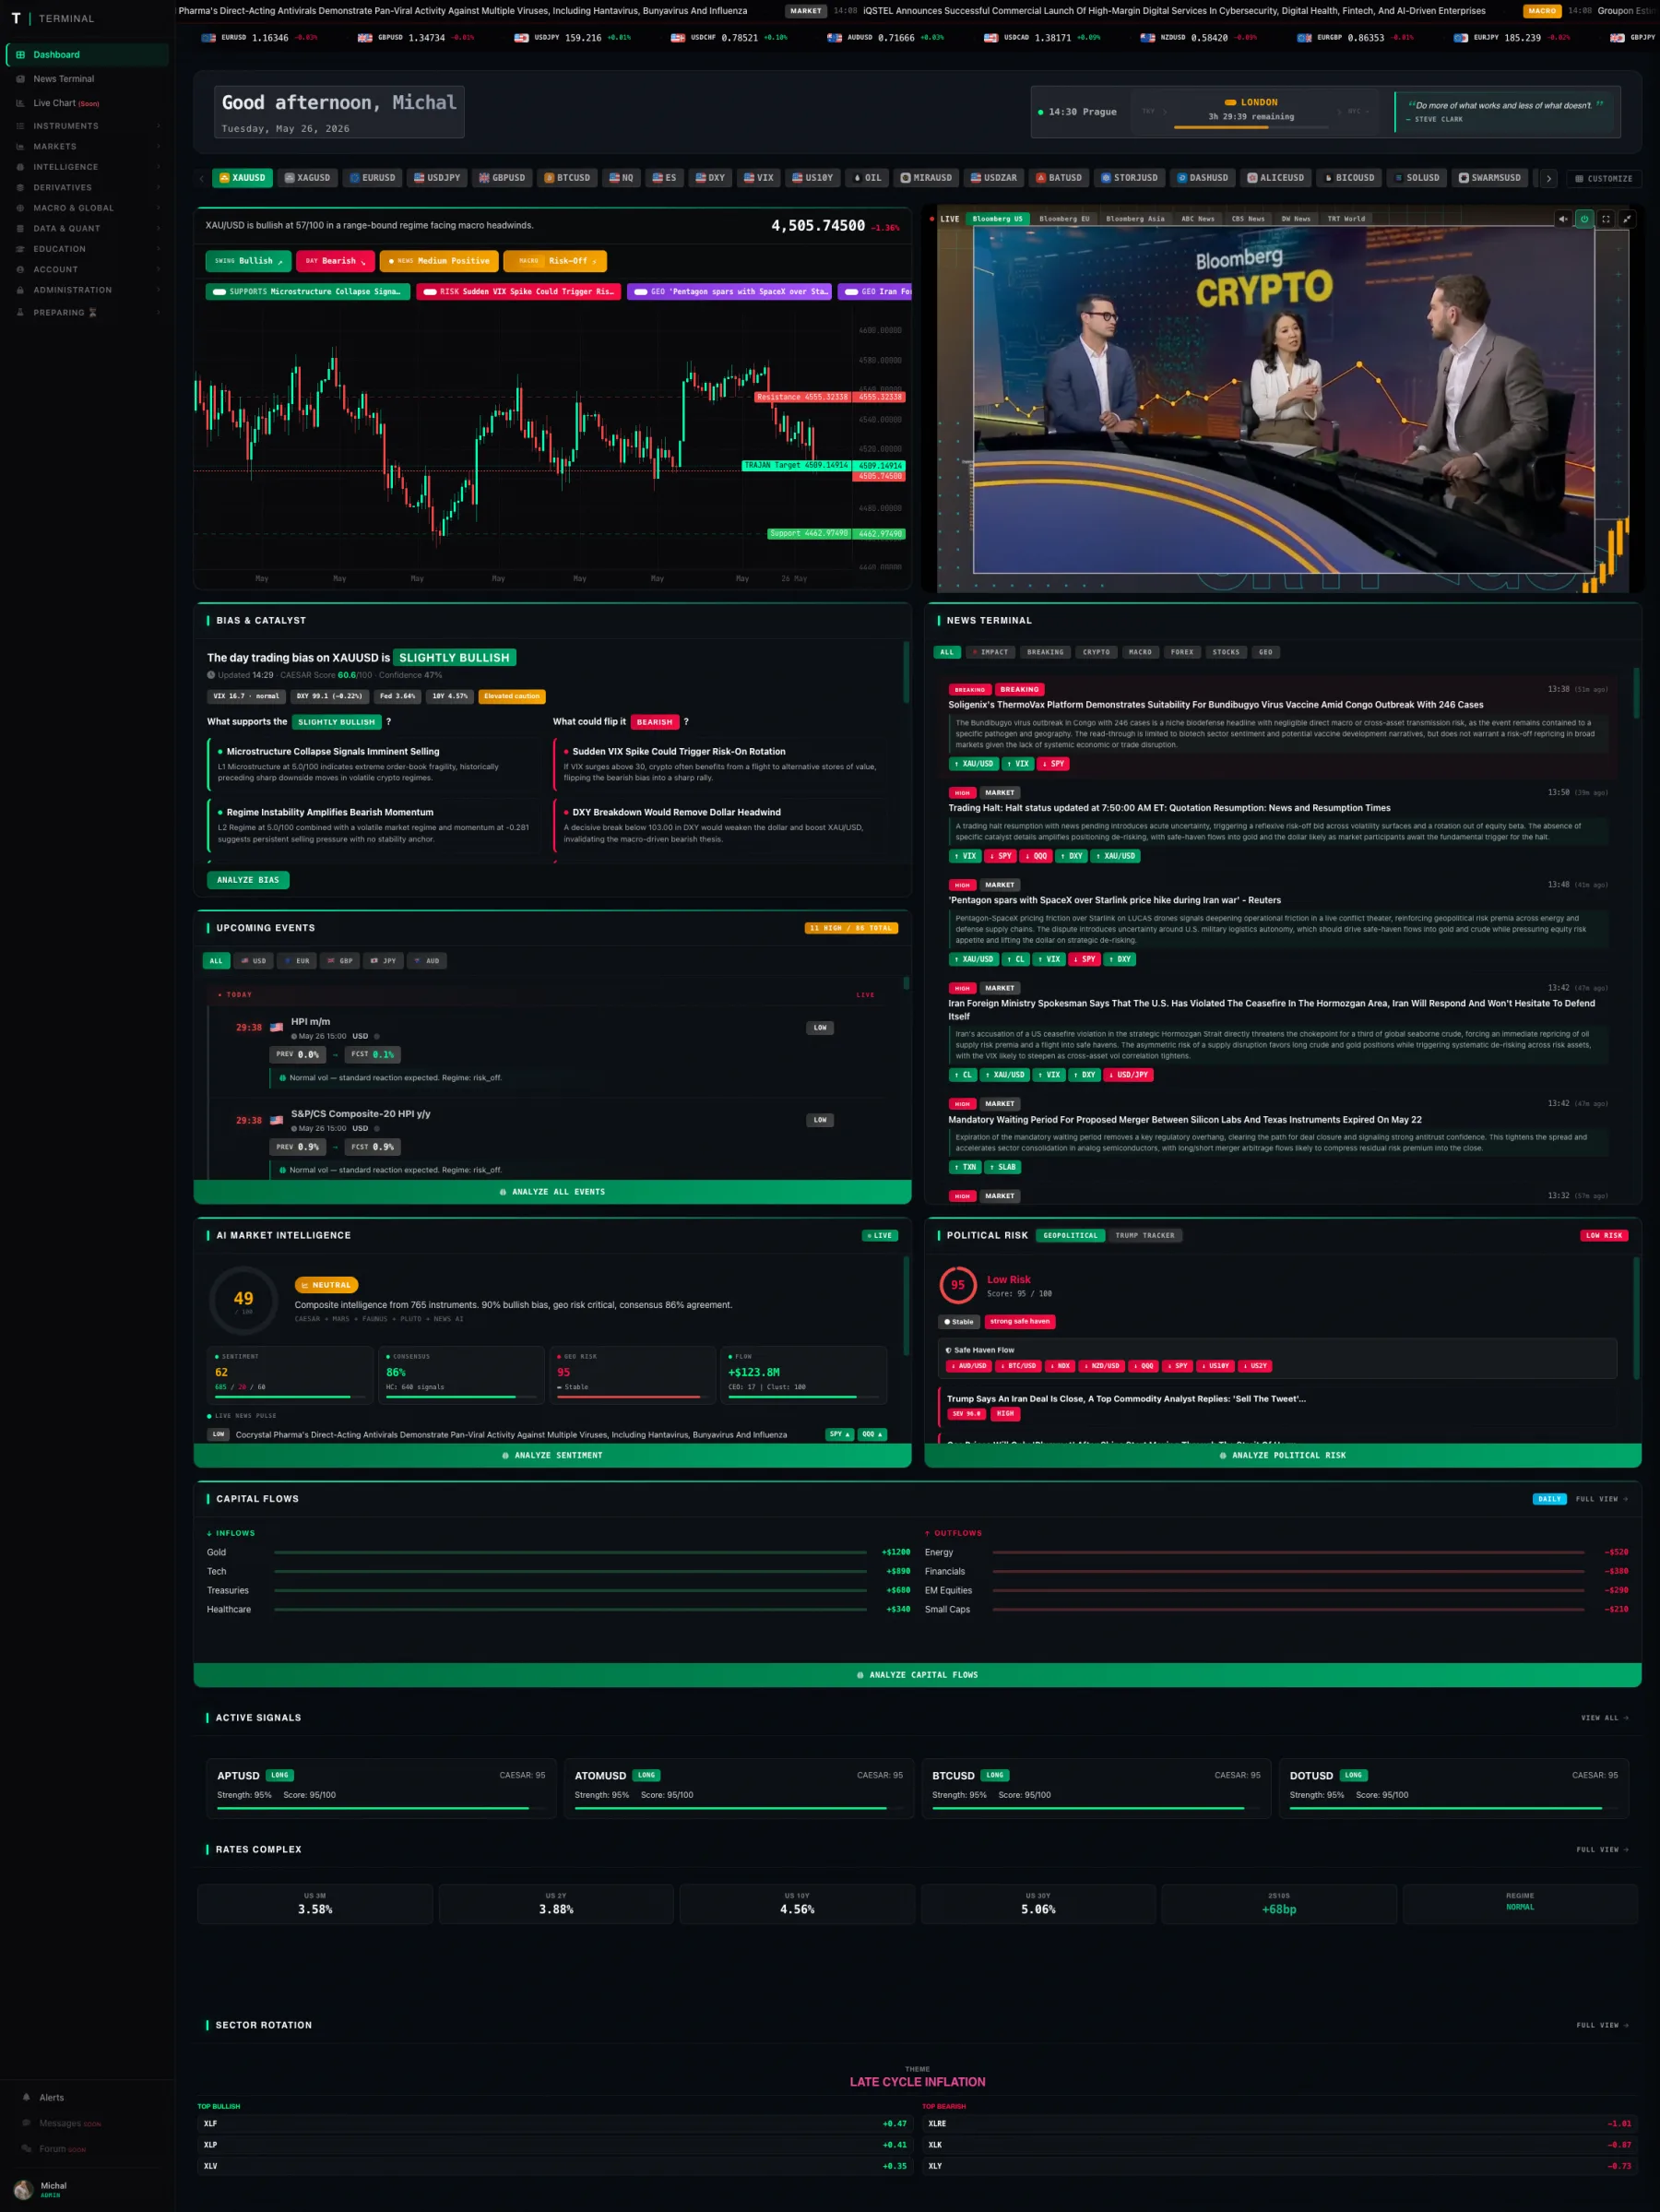
A real dashboard. Live data, live ML scores, live news, real watchlists. This is what you see the moment you log in.
Every tool inside TTerminal, organised by what you're trying to do. From the dashboard you start on each morning to the satellite-derived data feeds you'll discover months in.
A real dashboard. Live data, live ML scores, live news, real watchlists. This is what you see the moment you log in.
Your customisable home base: live prices, ML conviction scores, watchlist movers, breaking news, and the events on the calendar for the next 24 hours - all in one view, all rebuilt to the layout you want.
Aggregated newswire from tier-1 financial sources, central bank releases, regulatory filings, and earnings reports. Every article is automatically scored for sentiment, impact, and the symbols it moves, then condensed into a two-sentence trader-focused summary.
Multi-pane charting with 60+ technical indicators, custom timeframes from 1-minute to weekly, multi-symbol overlays, and ML score bands plotted directly on the price chart. Launching soon
The full universe of 27,000+ tradeable assets. Filter by asset class, region, liquidity, volatility regime, or any combination of fundamental and technical criteria. Save custom universes for re-use across other tools.
Complete FX coverage - majors, minor crosses, and exotics - paired with our proprietary central bank policy bias model, real-time interest rate differentials, and live carry-trade ranking.
Spot and futures prices for precious metals, energy, base metals, and agricultural commodities. Layered with weekly inventory reports, COT positioning data, and supply-chain disruption signals.
Sovereign yield curves, swap rates, real yields, and inflation breakevens across the G10. Visualise curve shape, detect inversions early, and track central bank repricing in real time.
12,000+ US-listed equities and ETFs with sub-second price updates, full fundamentals, earnings calendar, insider transactions, and per-name flow analytics derived from off-exchange prints.
Spot prices, perpetual futures, funding rates, open interest, and liquidation clusters across major exchanges. BTC dominance and alt-season indicators for regime detection.
12,000+ global equity indices with sector breakdowns, breadth indicators, advance-decline data, McClellan oscillator, and VIX term structure for risk-regime detection.
A single screen showing live bull/bear pressure across every market we cover. Spot the rotation happening underneath index-level moves before it shows in price.
Search 27,000+ instruments by 50+ criteria simultaneously - price action, fundamentals, ML scores, flow, sentiment, technical patterns. Save queries, schedule them, get alerts when new entries appear.
Rolling correlation matrices across assets and timeframes. Detect when traditional correlations break - often the earliest signal that a market regime is shifting.
PLUTO surfaces what institutional money is actually doing: off-exchange dark pool prints, large block trades, ETF basket rebalances, and unusual options activity - aggregated into one flow score per ticker.
Cross-asset command centre showing every active ML score, signal, and narrative in a single view. Filter by asset class, conviction level, or time horizon to find your highest-confidence setups instantly.
A pre-market intelligence summary delivered each morning: overnight positioning shifts, the catalysts most likely to move price today, and our highest-conviction directional calls with explicit reasoning.
CAESAR is our flagship conviction engine. It fuses news sentiment, technical structure, central bank policy, and positioning data into a single 0-100 directional score - with the underlying drivers transparent for every call.
TRAJAN generates forward price distributions with explicit confidence intervals, alongside aggregated sell-side analyst consensus. Compare model forecast vs street view to identify mispricing.
Systematic detection of technical chart patterns - head-and-shoulders, triangles, flags, double tops - across the entire universe in real time. Each match is scored by historical follow-through probability.
A flexible workbench for building custom research workflows. Chain together filters, models, and visualisations into reusable templates. Share with mentors or keep private.
Aggregator of institutional research from 15+ major banks and policy bodies. 84+ active reports with structured forecasts, rate decision calls, FX targets, and house-view summaries in plain English.
Curated finance and economics papers from top journals and working paper repositories, with non-technical abstracts and links to underlying methodology.
Live aggregation of analyst price targets, rating changes, and consensus shifts across major investment banks - by symbol or by sector.
Statistical anomalies in price, volume, and flow surfaced as they happen. Each anomaly is z-scored against historical context and tagged with the most likely driver.
Transparent performance attribution for every ML model on the platform. Backtest results, walk-forward validation, and live forward accuracy - so you can see exactly which models are working in the current regime.
Earnings calendar with consensus EPS and revenue, options-implied move estimates, historical reaction analysis, and our pre-release directional bias for every reporting company.
Unusual options activity ranked by premium relative to open interest and historical baseline. Highlights large bullish and bearish positioning by sophisticated participants in real time.
Complete options chain for every optionable instrument with live Greeks, implied volatility, IV rank, IV percentile, open interest, and put-call skew - plotted across strikes and expiries.
Track your live positions with real-time P&L, R-multiple analysis, drawdown monitoring, and aggregate risk exposure across asset classes. Tag trades, attach notes, and build a journal that compounds.
Unified macro dashboard: yields, currencies, commodities, breadth, and credit spreads side-by-side. Spot regime shifts the moment cross-asset signals align.
Short-term interest rate futures across major central banks - SOFR, ESTR, SONIA, and others. Live pricing of rate path expectations with central bank speaker tracking.
Live risk-on/risk-off regime detection from cross-asset correlations, safe-haven flows, and volatility term structure. Tells you which playbook the market is currently running.
Deep coverage of crude, gas, refined products, electricity, and carbon markets. Storage inventories, refinery utilisation, OPEC compliance, and pipeline flow data integrated.
Comprehensive macro events feed with impact ratings, forecast vs actual tracking, historical reaction tables, and our directional bias prediction for every high-impact release.
MARS continuously scores geopolitical risk per region, tracks trade chokepoints (Hormuz, Suez, Taiwan Strait, Bab-el-Mandeb), and translates each event into expected impact on specific asset prices via beta tables.
CFTC Commitments of Traders data parsed weekly and normalised into z-scores. Highlights statistical extremes in managed money vs commercial positioning that historically precede reversals.
Quarterly 13F filings ingested within hours of release. Track holdings, new positions, and exits by 4,000+ institutional managers - searchable by manager or by stock.
Separates daily price action into Asian, European, and US sessions. Identifies overnight gap patterns, session bias, and which session is driving the current move.
Real-time tracker of US administration events, executive orders, and policy announcements with their direct and indirect market impact paths.
Catalogue of every alternative data feed we integrate, with explanations of what each signal measures and how it has historically predicted price movement.
Aggregated retail sentiment from public social channels, filtered for spam and weighted by historical predictive value. Flags when retail positioning becomes a contrarian signal.
Historical regime analogue search. Given today's macro conditions, finds the closest matching periods in the past 50 years and shows what happened next across every asset class.
Real-economy signals from shipping rates, container throughput, freight indices, and trucking activity. Often a leading indicator for commodity prices and industrial earnings.
Satellite-derived data: oil storage tank levels, retail parking lot footfall, mining and shipping activity. The same data hedge funds pay six figures for - included with your subscription.
Structured course library covering everything from the basics of order types to advanced volatility modelling. Designed for self-paced learning with practical exercises.
Profiles of verified professional mentors with track records, specialisation areas, signal performance statistics, and reviews from existing subscribers.
Subscribe to signals from selected mentors, receive entries and exits in real time through the platform and via Telegram, with full historical performance tracking.
Your personal trading journal with automatic P&L calculation, R-multiple analysis, win-rate by setup, and the ability to attach notes, screenshots, and post-trade reviews to every position.
Manage your profile, view subscription status, download invoices, and access your billing history. Update payment method or change plan from a single screen.
Configure default chart settings, alert delivery channels, notification preferences, API keys, and two-factor authentication.
Earn experience points for actively using the platform - building screeners, completing courses, journaling trades. Unlock progressive rewards and feature access.
Track your platform mastery milestones. Achievements range from beginner tutorials to advanced quantitative workflows.
Refer other traders and earn recurring revenue share on their subscriptions. Real-time tracking dashboard with payouts processed monthly.
7-day free trial gives you full access to every dashboard above. Cancel anytime, no charge until day 7.